(Awaiting Approval) Logging & Monitoring
The Nextcloud Exchange Connector utilizes a robust logging framework based on Serilog. This system allows administrators to direct logs to multiple destinations, configure automatic file rotation, and seamlessly integrate with advanced monitoring stacks like Loki and Grafana for real-time observability.
All logging parameters are managed directly within your .env configuration file.
Step 1. Set the Log Level
Why this is needed: To control the volume of diagnostic data generated by the application and prevent your storage from filling up with unnecessary debug information.
You can set the global verbosity using the Serilog__MinimumLevel__Default parameter. The available levels are Information, Debug, Warning, and Error.
Warning: Avoid Debug Mode in Production
It is highly recommended to keep the log level set to Information for regular day-to-day operations. You should only change this value to Debug if explicitly instructed by Sendent Support to capture detailed diagnostics for bug resolution. The Debug level generates a massive amount of data and can quickly consume disk space and degrade performance.
Step 2. Choose the Log Output Destination
Why this is needed: To route log streams to the most convenient storage or viewing platform based on your deployment architecture (Docker vs. Binary).
The application uses a bitwise configuration for the Service__LoggingConfiguration__LogsOutput parameter. This means you can combine multiple output destinations by summing their respective values.
0= None1= Console (Standard Output)2= Database4= File System8= Grafana / Loki (Requires Docker deployment)
Example: If you want to view logs in the console (1) and also save them to a file (4), you add those numbers together and set the value to 5.
# Outputs logs to both Console and File System (1 + 4 = 5)Service__LoggingConfiguration__LogsOutput=5Step 3. Configure File Logging & Rotation
Why this is needed: If you choose to write logs to the file system, you must limit their size and quantity so they do not exhaust your server's storage capacity over time.
Pro Tip: Recommended for Binary Installations
Using File System logging (value 4 or 5) is the highly recommended approach for Binary (.NET) installations. The application will automatically generate the configured log folder directly inside each worker's root directory, keeping logs perfectly isolated per instance.
You can customize the folder name and rotation rules using the following parameters:
# The name of the directory where log files will be savedService__LoggingConfiguration__LogDirectoryPath=SendentLogs # Maximum size of a single log file in Megabytes (MB)Service__LoggingConfiguration__LogFileSizeLimit=50 # Maximum number of historical log files to retain before automatic deletionService__LoggingConfiguration__LogFileAmountLimit=20Step 4. Advanced Monitoring with Grafana & Loki (Docker Only)
If you are using the Docker deployment method, the docker-compose.yml file includes pre-configured Loki and Grafana containers. To send logs to this stack, you must include 8 in your Service__LoggingConfiguration__LogsOutput parameter and define the internal URL and credentials.
# Example: Console + Grafana (1 + 8 = 9)Service__LoggingConfiguration__LogsOutput=9 # Internal Docker network URL for LokiService__LoggingConfiguration__LokiInternalUrl=http://loki:3100 # Administrator credentials for the Grafana Web UIGRAFANA_USER=SuperAdminGRAFANA_PASSWORD=YourSecurePassword123!Warning: Grafana Security & Access
By design, the Grafana web interface (accessible on port 3000) is bound exclusively to 127.0.0.1 (localhost) on your host machine. It is intentionally not exposed or forwarded to external networks out-of-the-box. This is a strict security measure to prevent unauthorized access to your system logs.
Step 5. Accessing Your Logs
Depending on your chosen LogsOutput value, here is how you can view your logs:
1. Console Output (Value: 1)
Docker Deployment: Open your terminal, navigate to the directory containing your
docker-compose.ymlfile, and run the following command to stream logs in real-time:
docker compose logs -fBinary Deployment: The logs will be printed directly in the active terminal or command prompt window where you executed the
dotnet Sendent.Synchronisation.Service.dllstart command.
2. Database Output (Value: 2)
Open a database management tool (e.g., pgAdmin, DBeaver, or SQL Server Management Studio).
Connect to your configured database using the credentials from your
.envfile.Query the automatically generated
Logstable within yourSendentDBdatabase to view the records.
3. File System Output (Value: 4)
Navigate to the directory you specified in the
Service__LoggingConfiguration__LogDirectoryPathvariable (e.g.,/SendentLogs/).You can open these
.txtfiles with any standard text editor (Notepad, VS Code).
On Linux servers, you can monitor the latest file in real-time using the tail command:
tail -f SendentLogs/log*.txt4. Grafana Dashboard (Value: 8)
Open a web browser on the host machine where your Docker containers are running.
Navigate to
http://127.0.0.1:3000orhttp://localhost:3000.Log in using the
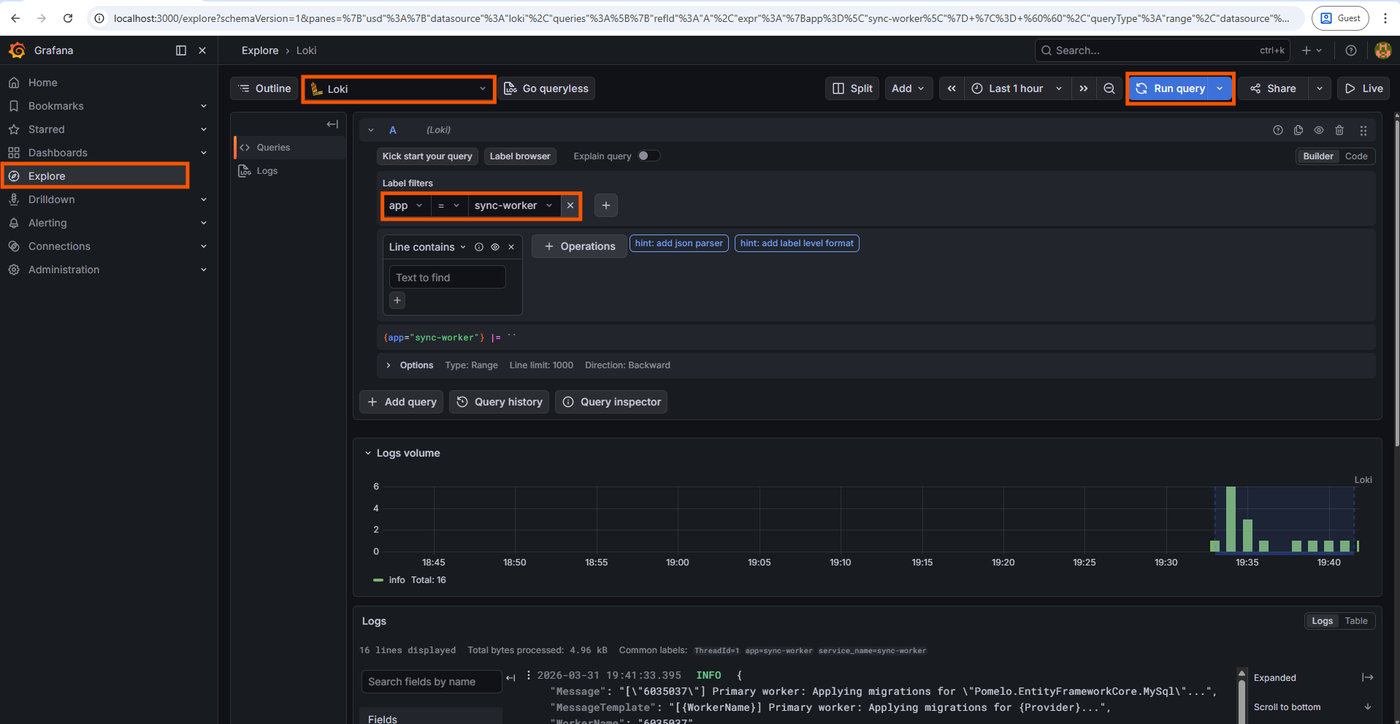
GRAFANA_USERandGRAFANA_PASSWORDvalues you set in your.envfile.In the left sidebar, click the Explore icon (a compass symbol).
Select the Loki data source from the dropdown menu at the top left.
In the Label filters, select
appand the worker’s name you’d like to track logs.From here, you can run queries to view and filter your formatted logs.