(Awaiting Approval) Logging Configuration
This guide provides the exact .env file parameters required to set up your preferred logging methods.
All logging settings are managed directly within your .env configuration file.
Step 1. Set the Log Level
To control the volume of diagnostic data generated by the application and prevent your storage from filling up with unnecessary debug information, set the global verbosity using the Serilog__MinimumLevel__Default parameter.
The available levels are Information, Debug, Warning, and Error.
Warning: Avoid Debug Mode in Production
It is highly recommended to keep the log level set to Errorfor regular day-to-day operations. You should only change this value to Debug if explicitly instructed by Sendent Support to capture detailed diagnostics for bug resolution. The Debug level generates a massive amount of data and can quickly consume disk space and degrade performance.
Step 2. Choose the Log Output Destination
The application uses a bitwise mathematical configuration for the Service__LoggingConfiguration__LogsOutput parameter. This means you can combine multiple output destinations simply by summing their respective values.
0= None1= Console2= Database4= File System8= Grafana / Loki
Examples:
To log to the Console and the Database, set the value to
3(1 + 2).To log to the Console and the File System, set the value to
5(1 + 4).To log to the Console and Grafana, set the value to
9(1 + 8).
Service__LoggingConfiguration__LogsOutput=5Step 3. Method-Specific Configurations
Depending on the output methods you selected in Step 2, you may need to define additional parameters.
Database Configuration (If using value 2)
If you included 2 in your bitwise sum, no additional logging-specific variables are required. The application will automatically route the logs using the DatabaseConfiguration__ConnectionString you already defined in the core .env settings.
File System Configuration (If using value 4)
If you included 4 in your bitwise sum, you must configure the folder and rotation limits to prevent your hard drive from filling up.
# The name of the directory where log files will be saved (e.g., /SendentLogs/)# Leaving this variable blank creates logs folder by defaultService__LoggingConfiguration__LogDirectoryPath=SendentLogs # Maximum size of a single log file in Megabytes (MB)Service__LoggingConfiguration__LogFileSizeLimit=50 # Maximum number of historical log files to retain before automatic deletionService__LoggingConfiguration__LogFileAmountLimit=20Grafana & Loki Configuration (If using value 8)
If you included 8 in your bitwise sum, you must provide the internal routing URL and establish your administrator credentials.
# Internal Docker network URL for LokiService__LoggingConfiguration__LokiInternalUrl=http://loki:3100 # Administrator credentials for the Grafana Web UIGRAFANA_USER="SuperAdmin"GRAFANA_PASSWORD="YourSecurePassword123!"Warning: Grafana Security & Access
By design, the Grafana web interface (accessible on port 3000) is bound exclusively to 127.0.0.1 (localhost) on your host machine. It is intentionally not exposed or forwarded to external networks out-of-the-box. This is a strict security measure to prevent unauthorized access to your system logs.
Step 5. Accessing Your Logs
Depending on your chosen LogsOutput value, here is how you can view your logs:
Console Output (Value: 1)
Docker Deployment: Open your terminal, navigate to the directory containing your
docker-compose.ymlfile, and run the following command to stream logs in real-time:
docker compose logs -fBinary Deployment: The logs will be printed directly in the active terminal or command prompt window where you executed the
dotnet Sendent.Synchronisation.Service.dllstart command.
Database Output (Value: 2)
Open a database management tool (e.g., pgAdmin, DBeaver, or SQL Server Management Studio).
Connect to your configured database using the credentials from your
.envfile.Query the automatically generated
Logstable within yourSendentDBdatabase to view the records.
File System Output (Value: 4)
Navigate to the directory you specified in the
Service__LoggingConfiguration__LogDirectoryPathvariable (e.g.,/SendentLogs/).You can open these
.txtfiles with any standard text editor (Notepad, VS Code).
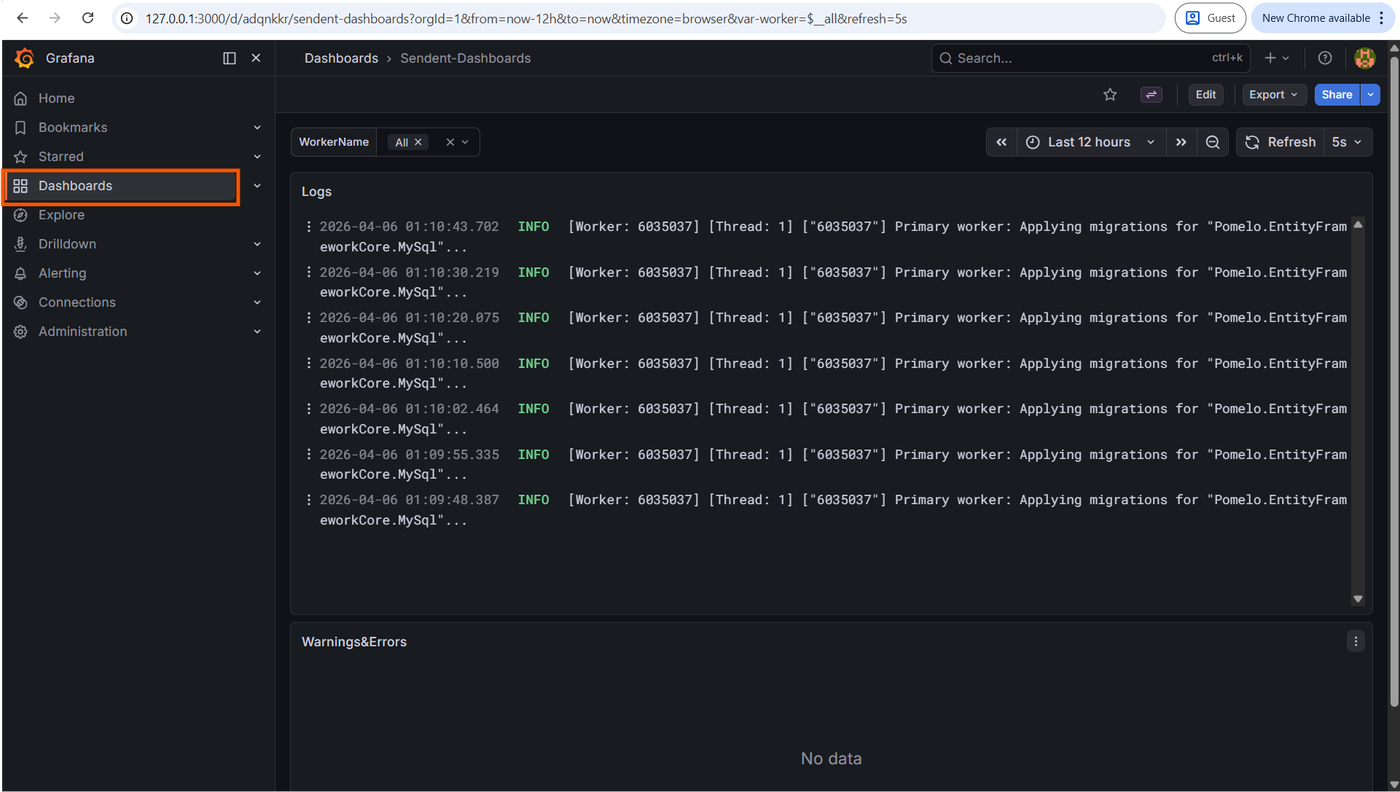
Grafana Dashboard (Value: 8)
Open a web browser on the host machine where your Docker containers are running.
Navigate to
http://127.0.0.1:3000orhttp://localhost:3000.Log in using the
GRAFANA_USERandGRAFANA_PASSWORDvalues you set in your.envfile.In the left sidebar, click the Dashboards icon.
Select the Sendent-Dashboards.