Grafana Logging Configuration
This guide provides the exact .env file parameters required to set up Grafana and Loki logging. This method is preferable for Docker deployments. All logging settings are managed directly within your .env configuration file.
Warning: Grafana Security
By design, the Grafana web interface (accessible on port 3000) is bound exclusively to 127.0.0.1 (localhost) on your host machine. It is intentionally not exposed or forwarded to external networks out-of-the-box as a strict security measure to prevent unauthorized access to your system logs.
Step 1. Set the Log Level
To control the volume of diagnostic data generated by the application and prevent your storage from filling up with unnecessary debug information, set the global verbosity using the Serilog__MinimumLevel__Default parameter.
The available levels are Information, Debug, Warning, and Error.
Warning: Avoid Debug Mode in Production
It is highly recommended to keep the log level set to Errorfor regular day-to-day operations. You should only change this value to Debug if explicitly instructed by Sendent Support to capture detailed diagnostics for bug resolution. The Debug level generates a massive amount of data and can quickly consume disk space and degrade performance.
Step 2. Select the Log Output Destination
The application uses a bitwise mathematical configuration for the Service__LoggingConfiguration__LogsOutput parameter. To enable Grafana output, you must include the value 8.
Service__LoggingConfiguration__LogsOutput=8If you wish to combine Grafana logging with other methods, simply sum their respective values (e.g., 1 for Console + 8 for Grafana = 9).
Step 3. Method-Specific Configurations
Because Grafana relies on an internal Loki container to parse the logs, you must provide the internal routing URL and establish your administrator credentials for the web interface in your .env file.
# Internal Docker network URL for LokiService__LoggingConfiguration__LokiInternalUrl=http://loki:3100 # Administrator credentials for the Grafana Web UIGRAFANA_USER="SuperAdmin"GRAFANA_PASSWORD="YourSecurePassword123!"Step 4. Accessing Your Logs
Open a web browser on the host machine where your Docker containers are running.
Navigate to
http://127.0.0.1:3000orhttp://localhost:3000.Log in using the
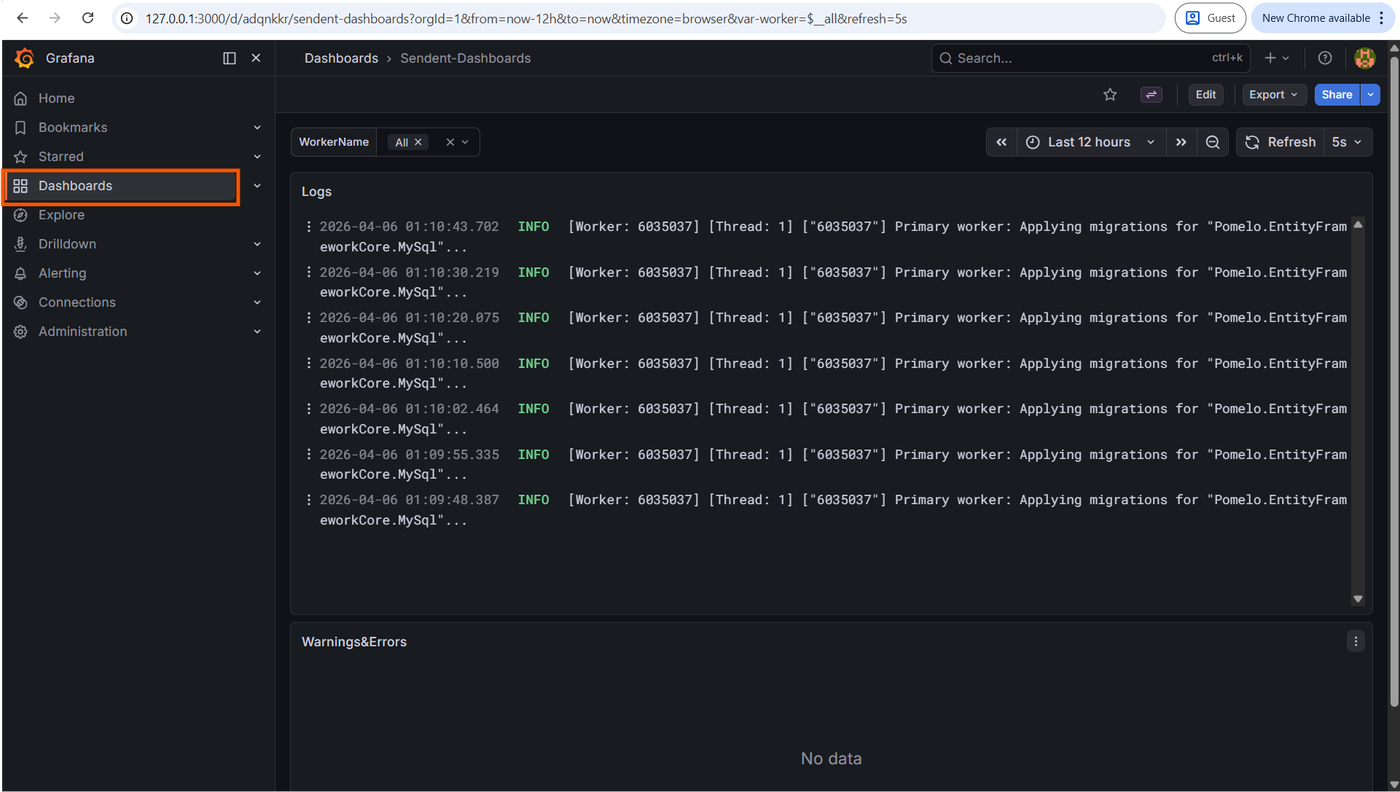
GRAFANA_USERandGRAFANA_PASSWORDvalues you set in your.envfile.In the left sidebar, click the Dashboards icon.
Select the Sendent-Dashboards.